
One of its most eagerly anticipated statistical reports, the INC has published the new edition of the Nut and Dried Fruit Trade Map series.
Featuring six separate maps, the report shares a visual representation of the main nut and dried fruit trade flows between top origins and destinations, as well as the traded volumes of each nut and dried fruit for the year 2022. Published every two years, the Nut and Dried Fruit Trade Maps are an invaluable tool for the sector and the full series is available on the INC website within the private members area. The following article gives an overview of the key data that can be found in each map.
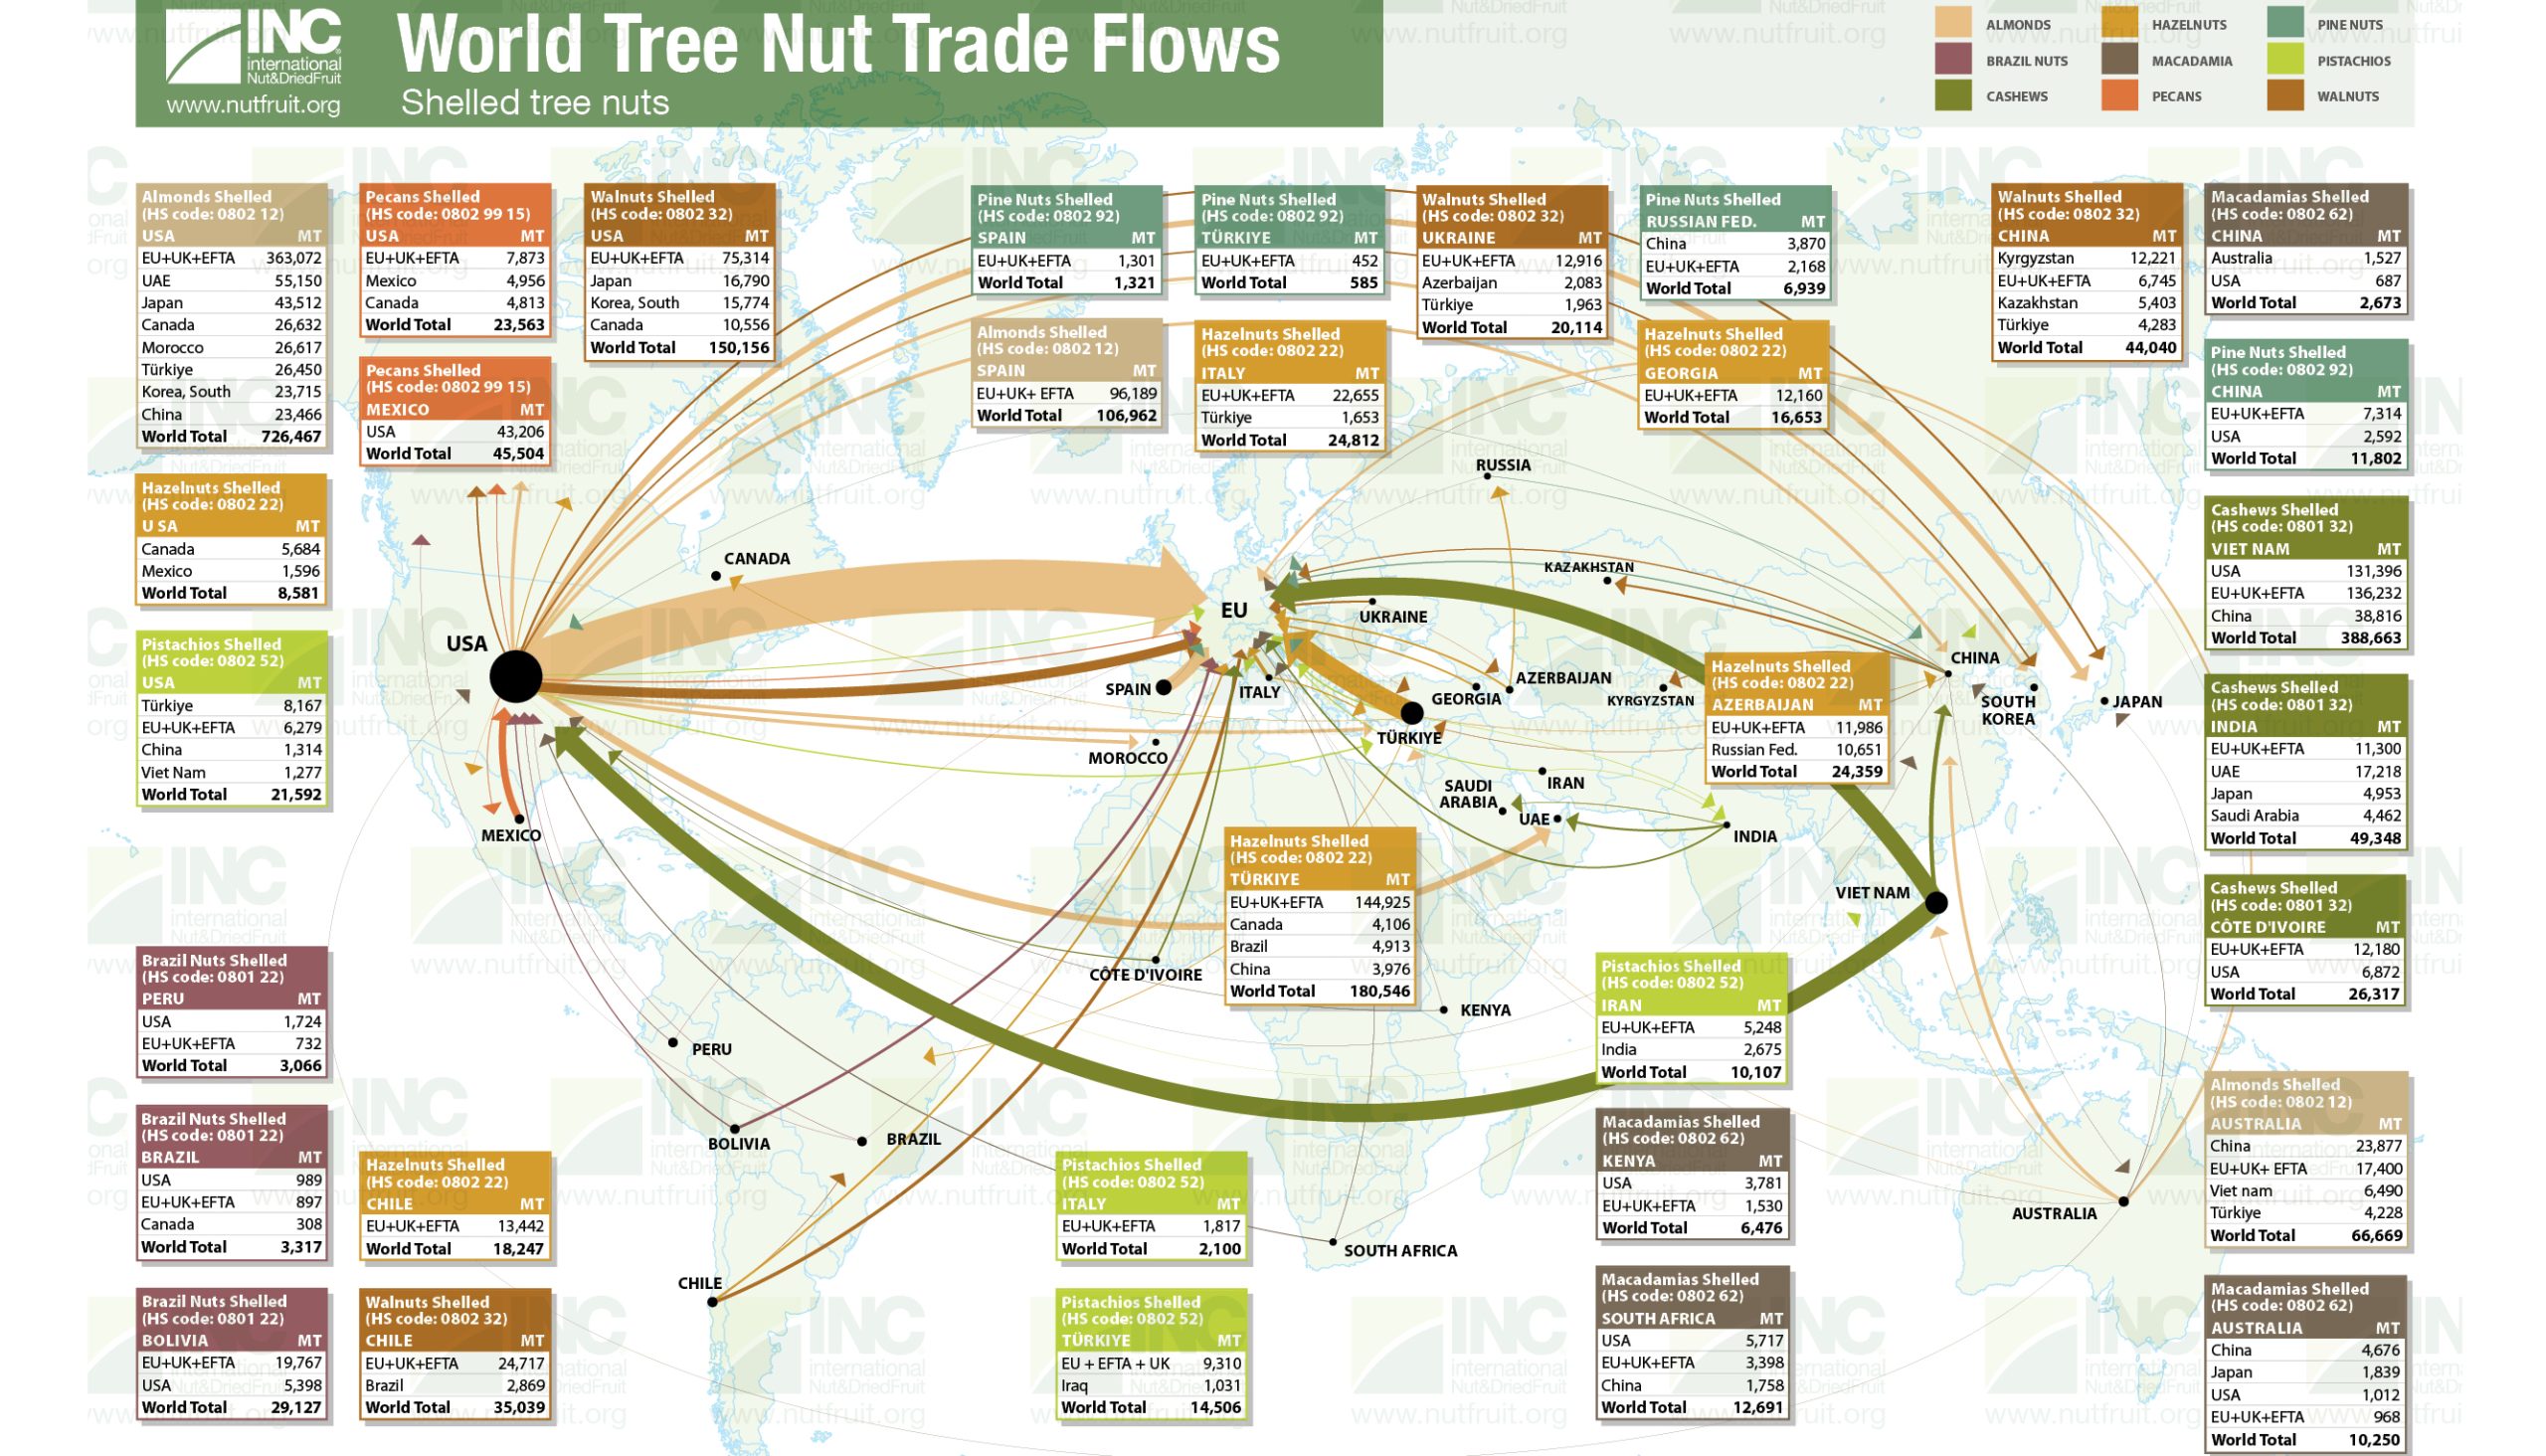
- World Tree Nut Trade Flows (shelled): During 2022, 2.5 million metric tons of shelled tree nuts were traded worldwide. With over one million metric tons and 42% of the global share, almonds led the international shipments volume-wise; followed by cashews (23%), walnuts (13%) and hazelnuts (12%). Overall, the USA (938,000 MT), Viet Nam (392,000 MT), Türkiye (229,200 MT), Spain (116,000 MT) and Australia (78,200 MT) were the main exporting origins. EU+EFTA countries were the top importing markets, which added up to over 1.2 M MT. Asia and Northern America followed with 666,200 MT and 300,500 MT, respectively.
- World Tree Nut Trade Flows (in-shell): Worldwide in-shell tree nuts trade last year added up to over 6.1 million metric tons. With 2.3 M MT, in-shell cashews (raw cashew nuts) were the most traded tree nut. In-shell almonds added up to 12% of the world share, followed by walnuts (10%) and pistachios (8%). Led mainly by India, and followed by Viet Nam and China, to a lesser extent, Asia was the top importing region of in-shell tree nuts. Total amount last year reached over 3.1 M MT. The main exporting origins were Western Africa (1.9 M MT), the USA (680,000 MT), Eastern Africa (319,000 MT) and Chile (90,900).
- Intra-European Tree Nut Trade Flows (shelled + in-shell converted to kernel equivalent): Over the last year, 455,700 metric tons (kernel equivalent) of tree nuts were traded intra-Europe. The leading exporters were Spain (27%), Germany (19%), the Netherlands (18%), Italy (10%) and Portugal (5%).
- Peanut Trade Flows (shelled): Shelled peanut international shipments across 2022 reached 3.1 million metric tons. Argentina was the leading exporter, amounting to 23% of the total share, followed by India (18%), Sudan (12%), Brazil (10%) and the USA (9%). Asia was the top importing market (1.3 M MT), led by China and followed by South-Eastern Asia. Europe ranked second with imports amounting to 1.2 M MT.
- World Dried Fruit Trade Flows: Over 2.7 million metric tons of dried fruits were shipped globally in 2022. Dates dominated the exports volume with 1.2 million metric tons and 44% of the world market, followed by dried grapes (30%), prunes (8%), figs (8%), dried cranberries (7%) and dried apricots (6%). The Middle East was the main dried fruit exporting area, led by Türkiye (500,500 MT) and followed by Iran, Iraq (220,100 MT) and the UAE (202,000 MT). In turn, exports out of Northern Africa amounted to 312,000 MT; 251,200 MT were exported from Northern America and 198,500 MT from South America. Europe remained the largest destination (1 M MT), followed by India (491,100 MT) and China (110,942 MT).
- Intra-European Dried Fruit Trade Flows: European dried fruit trade in 2022 amounted to about 24,550 metric tons. The leading exporters being the Netherlands (22%), Germany (16%), France (13%), Greece (11%) and Spain (10%).